
Pacing an Ironman
- Loren Lane
- Mar 13, 2020
- 4 min read

From 8 hours to 17 hours it's a long day and pacing is crucial to success in Ironman. Get it slightly wrong and it can end with you crawling to the finish line or not making it at all. Don't get me wrong, Ironman hurts but pace it correctly and the pain will be easily managed followed by the joy of running down the red carpet knowing you've controlled your race and left everything out there on the course.
Last weekend we had 5 HLT athletes racing in Taupo (3 doing the full and 2 on the 70.3). I want to focus on one athlete in particular who completed his second full Ironman and how he went from strength to strength through the day cracking the 11-hour barrier.

Meet Mark. Mark is a 35-39 male who is relatively new to the sport. He epitomizes hard work having trained for this race through smokey summer days and extreme rain that Sydney has had leading up to his race. Mark went into Ironman New Zealand off the back of his debut Ironman in Busselton only 3 months earlier. After completing this race and learning the hard way what Ironman racing is all about he joined the HLT squad and got working on his goal of going sub 11 hours.
We reached race week with all of the hard work done. I put together his race plan with target goals for power on the bike and run pacing as the key to success. This is fairly common for a lot of you but the key is to trust the plan. It can be relatively unknown as mimicking race conditions in training is never 100%.
As the Garmin stats don't really give a clear indication of the swim, plus it could quite easily be described as the "transport to the start of the race", we will leave this one out rather than speculate.
"Swim and bike set up the race so the run can drive it home". This means you're not going to achieve your goal purely on the swim and bike but you can certainly screw it up.
Below are the bike course stats. I asked Mark to press lap at the turn of the first lap so he could get a read on how he was doing.

As you can see the course offers a climb out of town followed by about a 10km descent before returning and repeating for a second lap. Ironman New Zealand is known for being "honest" which purely means it's tough. You work for every second with no free speed and you can almost guarantee wind.
The lap splits are below and the first thing you'll note is the second lap was slower on time. The aim for Mark was to go out between 170-190W and not being afraid of going slower to start. From the testing we do, I could see that Mark's FTP is around 230W which means this target is about 74-83%, of that. From a few key training sessions, we'd worked out this was achievable.

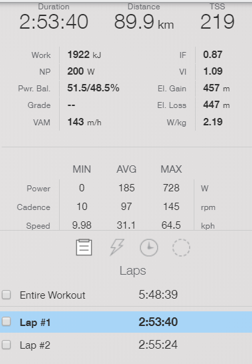

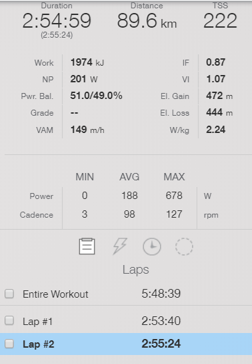
The key-notes are Mark's average power of 185W (200W Normalised) for Lap 1 and 188W (201W Normalised) for Lap 2. This is a clear indication of increasing power throughout the bike leg with no dropoff. It can be argued that the slower time is related to the conditions or perhaps being less aero. I'll support the case of the conditions changing as being more likely.
So after the bike leg, Mark has a big tick from me and can give himself a pat on the back for being controlled and setting himself up for the run leg. Mark also gets extra HLT kudos for his cadence which is a focus of ours in the squad.

Now on to the run, can he improve from his 4h25 run at Busso?
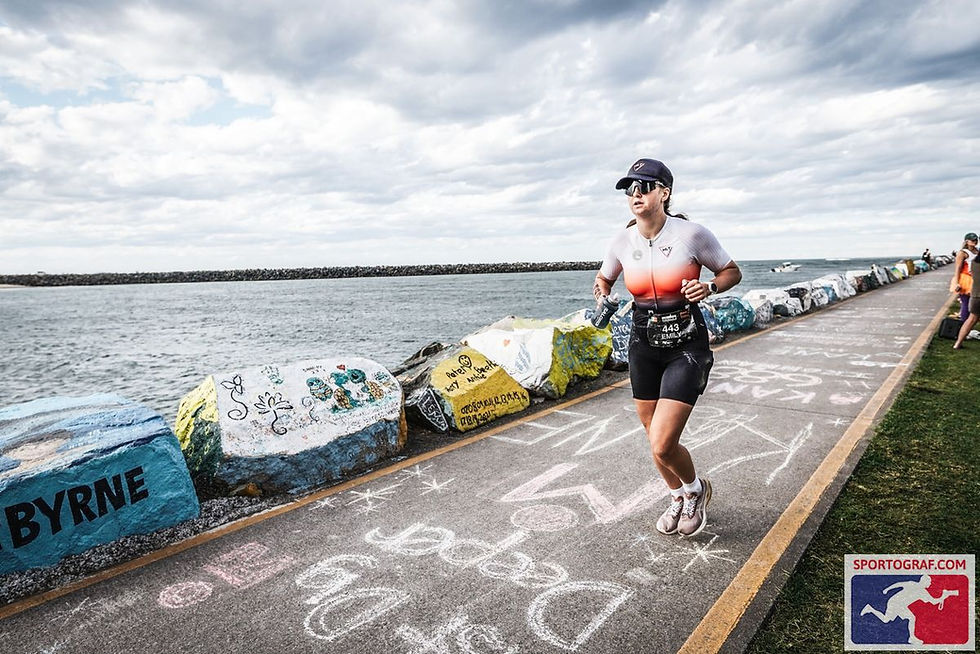
Taupo is one of the best run courses with the crowd cheering you on the whole way. You've got to tackle 3 laps with varied ups and downs. I've used Training Peaks to select his lap times so we can see how Mark paced these.

Our race plan was to negative split the run. Mark was well aware that 5:41 min/km average is a 4-hour marathon prior to the race and we'd agreed he was more than capable of exceeding this, but getting the usual scare tactics of "go out too hard and you'll feel it". We'd even agreed that going out at 6 min/km or slower was fine and encouraged.
Below are the lap breakdowns. Lap 1 we can see that the average pace was slower than the expected overall target by settling in at 5:46 min/km pace and average heart rate of 161 bpm. Lap 2 increased to an average of 5:24 min/km but interestingly he didn't really up this till about 24km in. Many would know how easy it is to go the other way at that stage of the race (me included). On to Lap 3, the glory lap, the lap you know you'll never have to see that piece of tarmac again with each step you take! Again Mark upped this average pace to 5:09 min/km. His fastest km was a 5:01 which just shows how consistent he was throughout the race.


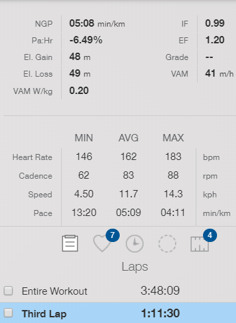
A really solid race with a huge 37min run leg improvement. The chart below is useful to see a comparison to the other athletes racing. The main column is "POS". This is a measurement of the position you came overall in that section of the race. This just proves how he was happy to be the 534th best for the first 5.5km of the run but finished with the 126th fastest sections near the back end.

Overall this was an impressive display from Mark to stick to his plan the whole way through. He'll tell you it was a tough day. The question the HLT squad wants to find out is how much can he improve for the next one. There's always room to improve!
Thanks, Mark for letting me share your data from the race and I look forward to seeing what you can achieve next!


Comments